echarts的仪表盘在Vue3中显示异常
2023.06.27
问题描述
在 Vue3 中使用 echarts 的仪表盘(gague),当仪表盘的数据为0时,仪表盘的轴线(axisLine)显示异常。
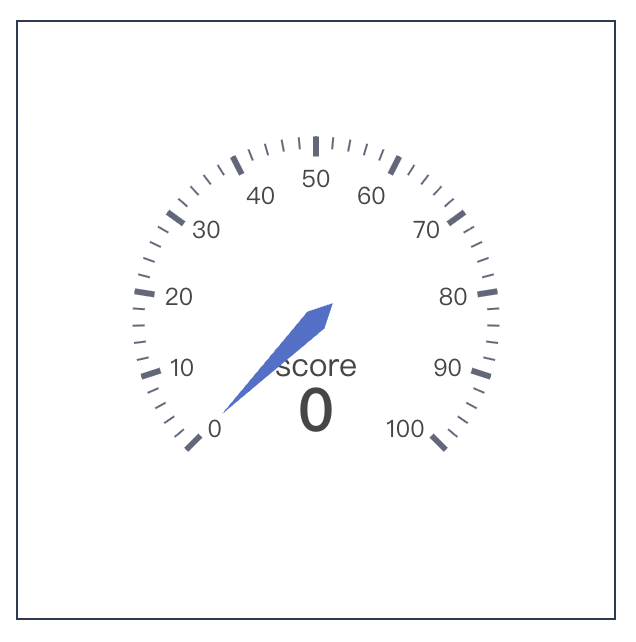
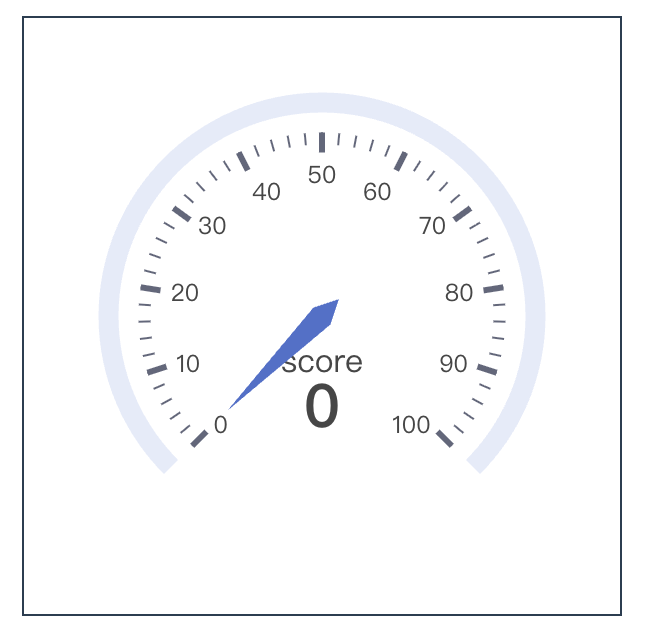
只有当鼠标在仪表盘上悬浮时轴线才会显示。
demo地址:CodeSandbox
代码如下:
vue
<template>
  <div>
    <div
      id="chart"
      style="width: 300px; height: 300px; border: 1px solid"
    ></div>
  </div>
</template>

<script setup>
import { getCurrentInstance, onMounted, ref } from "vue";
const { proxy } = getCurrentInstance();
const chartIns = ref(null);

function initChart() {
  chartIns.value = proxy.$echarts.init(document.getElementById("chart"));
  const options = {
    series: [
      {
        type: "gauge",
        axisLine: {
          show: true,
        },
        data: [
          {
            name: "score",
            value: 0,
          },
        ],
      },
    ],
  };
  chartIns.value.setOption(options);
}

onMounted(() => {
  initChart();
});
</script>解决过程与方案
一开始以为是 echarts 的 bug,于是去提了 issue,后来 echarts 的成员回复让我参考 echarts 常见问题事项,最终发现问题所在。
在 Vue 中应该尽量避免 echarts 的实例成为响应式对象,这会影响 echarts 对内部属性的访问,可能会导致图表无法正确显示等一系列意外问题,且会由于深度监听而极大的降低图表展示性能。